Some chapters flow smoothly, others are harder to read. The all-new Readability Statistics shows you how the levels of readability vary across your book.
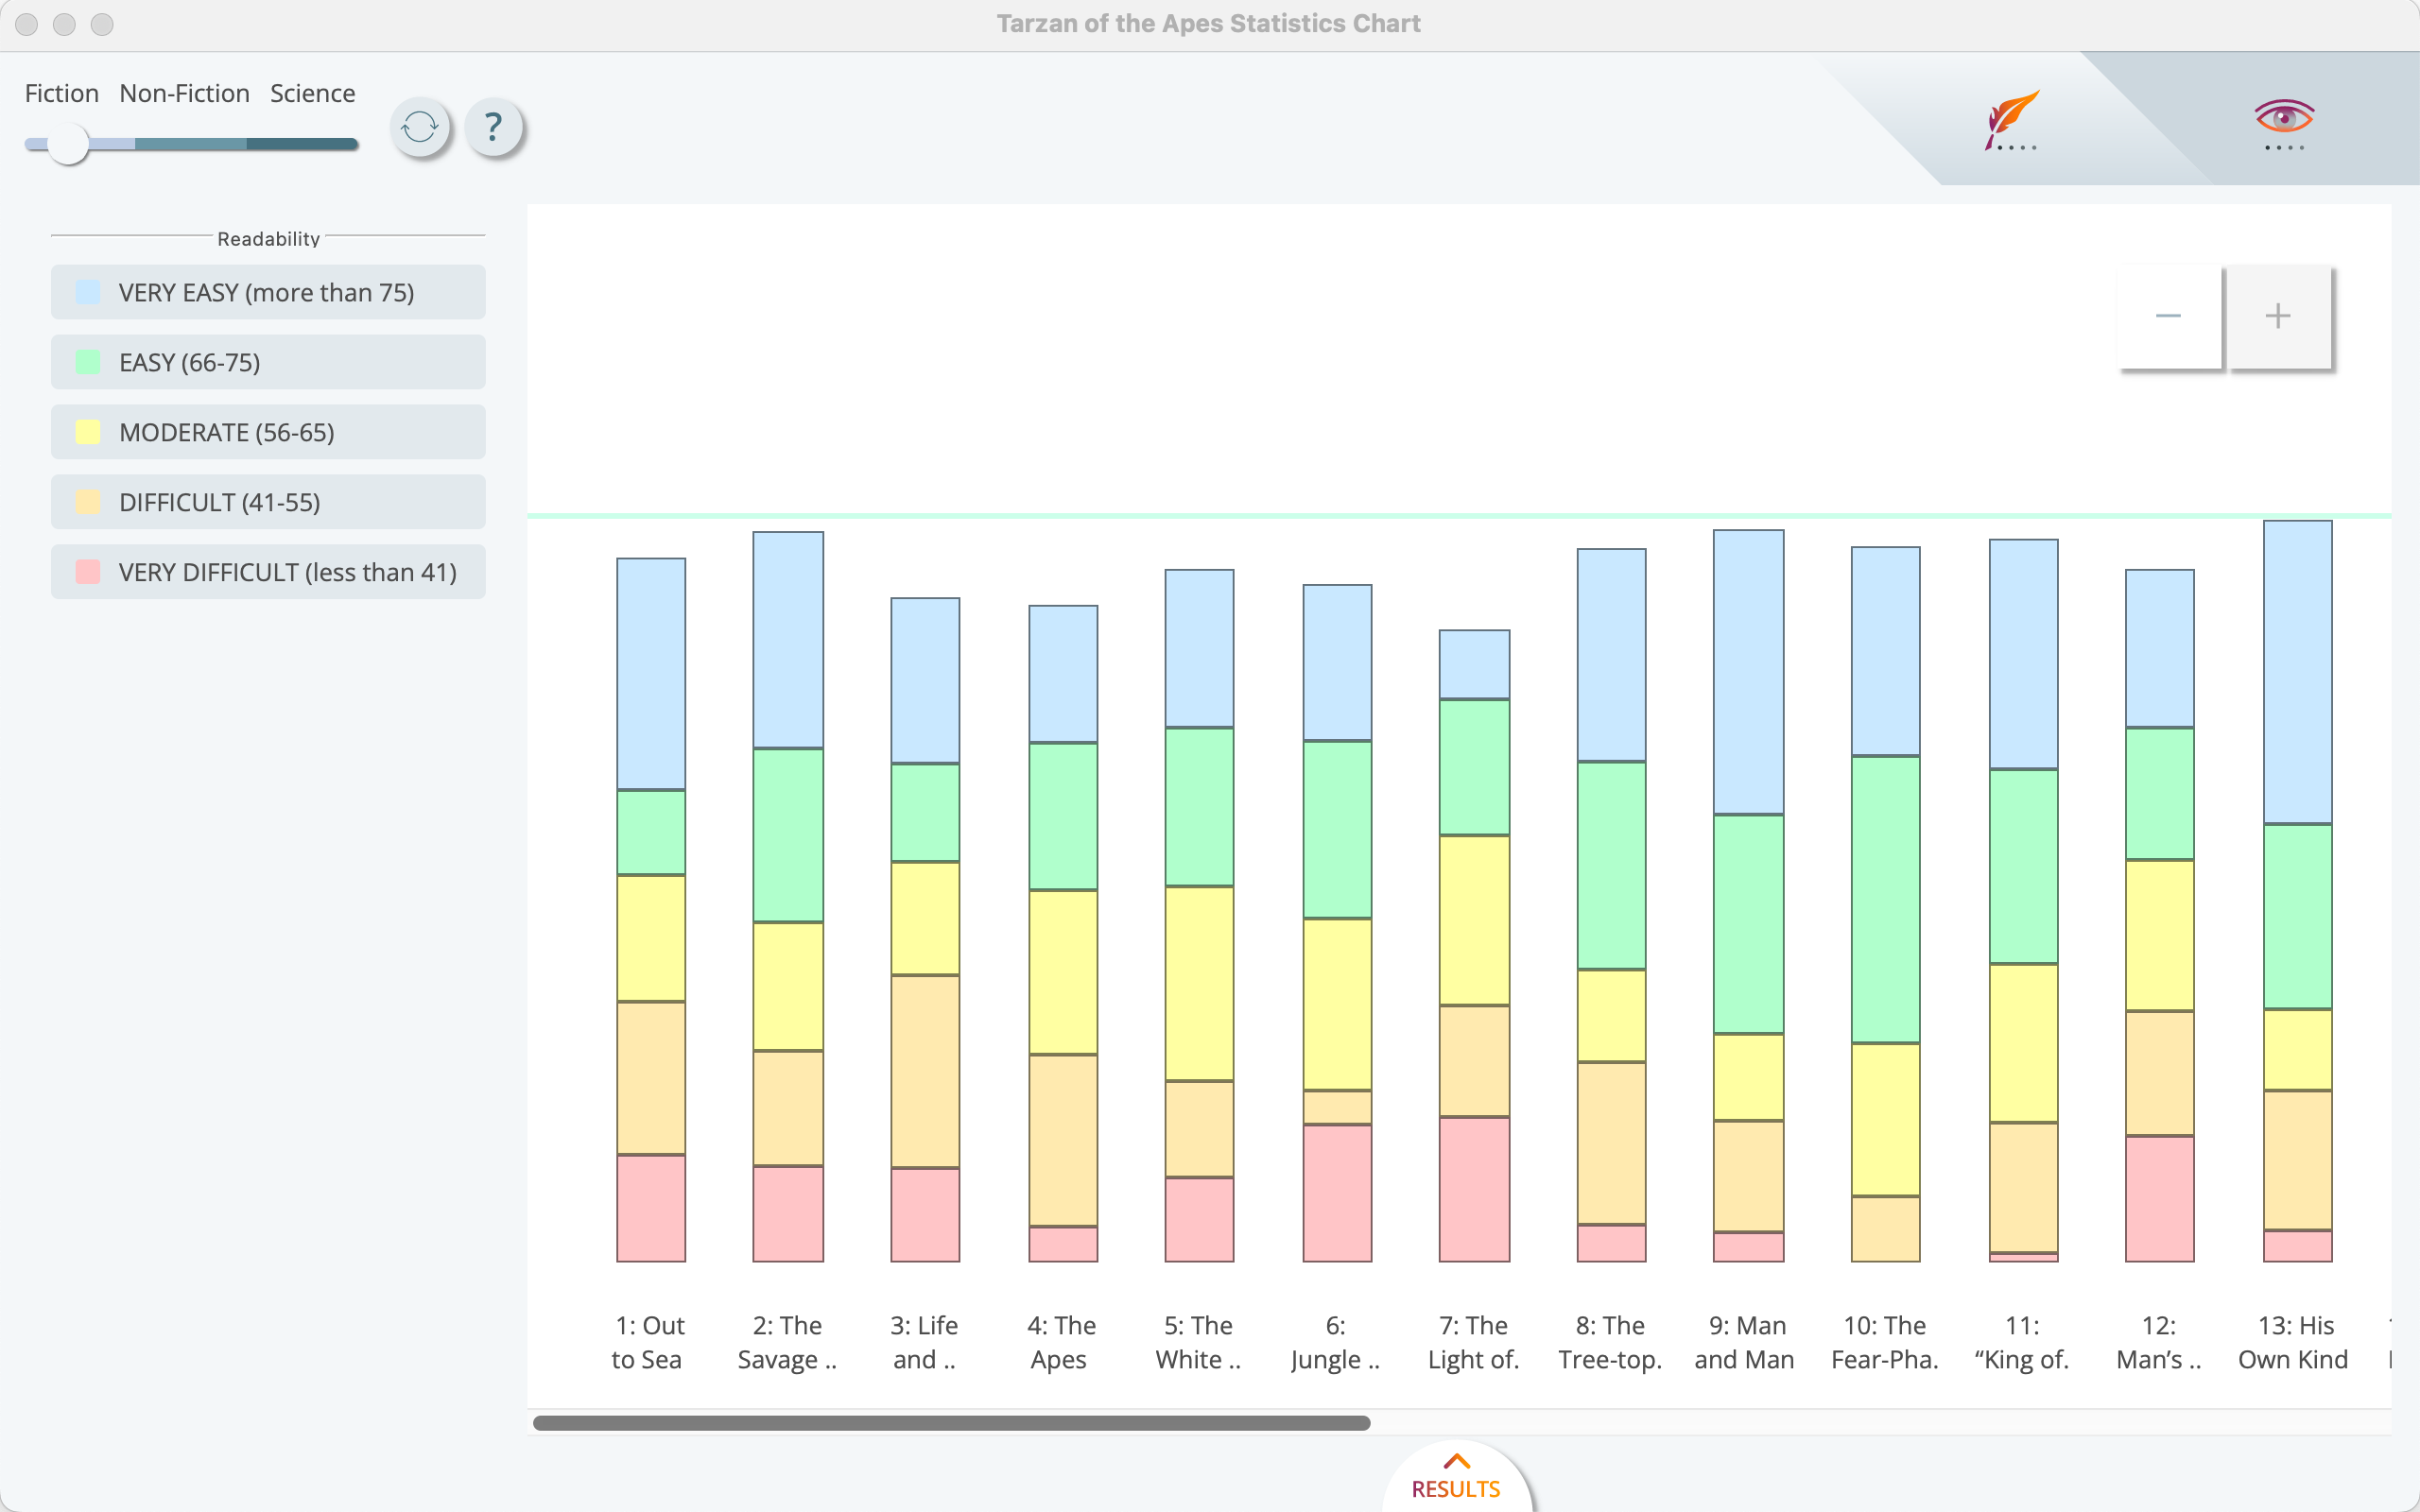
Each chapter now has a visualization of its readability levels—from ![]() difficult to
difficult to ![]() easy .
easy .
The bars with the most red and orange colors are the hardest to read ![]()
Readability Report
Click the arrow below the graph to get an overall readability report, and which chapters are the outliers in your book.
The analysis highlights chapters with inconsistent readability, where sections of your book shift noticeably in complexity in comparison to the rest of the book. If a chapter feels choppy or uneven, this helps pinpoint where to smooth things out. ![]()
Try it out:
Start with the Style Statistics ![]() in the toolbar, and select the
in the toolbar, and select the ![]() Readability Statistics tab in the top-right.
Readability Statistics tab in the top-right.
![]() Open the detailed readability report from “Results” button on the bottom of the Readability Statistics.
Open the detailed readability report from “Results” button on the bottom of the Readability Statistics.
![]() You can jump into a chapter by double-clicking on its bar.
You can jump into a chapter by double-clicking on its bar.